Reducing AB-plane data
So all of the earlier stuff was from the c-axis data:
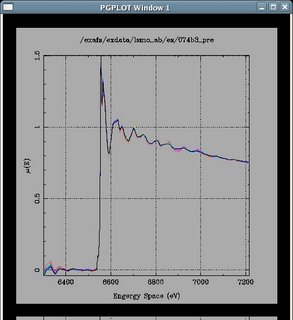
Here's the normalized plot in energy space of the ab-plane data:
Things get kinda funky in k-space. Here's the plot:
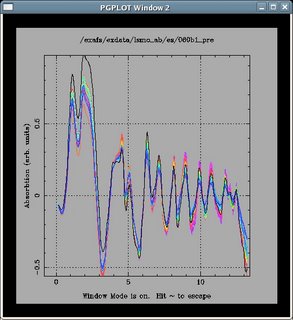
Notice the black highlighted outlying trace. That's 060b1:
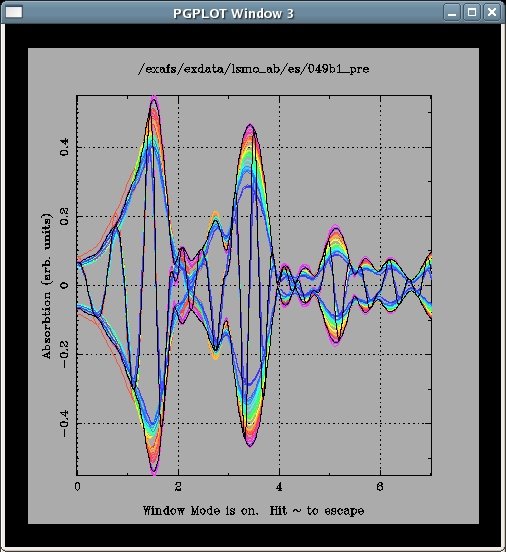
Here's is the real space data:
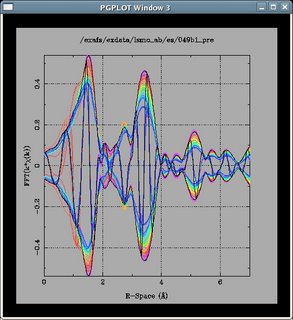
And here's the real space data post- y2 correction:
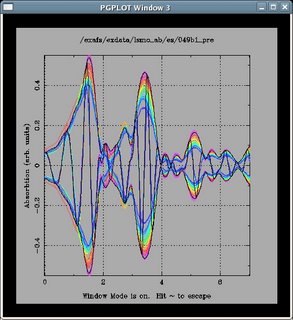
Guess what that red- low r outlier is...060b1- who would've thought?
Here's the normalized plot in energy space of the ab-plane data:

Things get kinda funky in k-space. Here's the plot:

Notice the black highlighted outlying trace. That's 060b1:
Here's is the real space data:

And here's the real space data post- y2 correction:
Guess what that red- low r outlier is...060b1- who would've thought?
posted by Jesse at 3:40 PM
![]()


0 Comments:
Post a Comment
<< Home