Figuring out E0
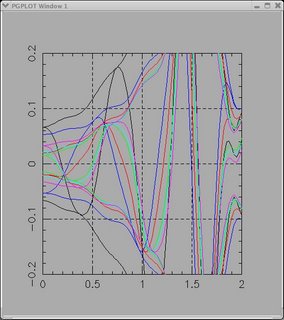
So to figure out what E0 is, we simply take the standard file and do a Fourier transform from k-space to r-space (using the same range of course) and plot it on top of a low temperature data file. You look at the zero crossings and then change the field "E0 shift in (eV)". Try 5.0eV and -5.0eV to get an idea of how to shift it. You can either shift the standard file, or the actual data file. Here's what I got:

Ok so the black trace (hard to see) is the actual real data file. The red trace is the UNshifted standard file. The blue trace is -5.0eV shifted, the green trace is +5.0eV, the cyan trace is shifted +6.0eV, and the magenta trace is at +8.0eV.

Ok so the black trace (hard to see) is the actual real data file. The red trace is the UNshifted standard file. The blue trace is -5.0eV shifted, the green trace is +5.0eV, the cyan trace is shifted +6.0eV, and the magenta trace is at +8.0eV.


0 Comments:
Post a Comment
<< Home